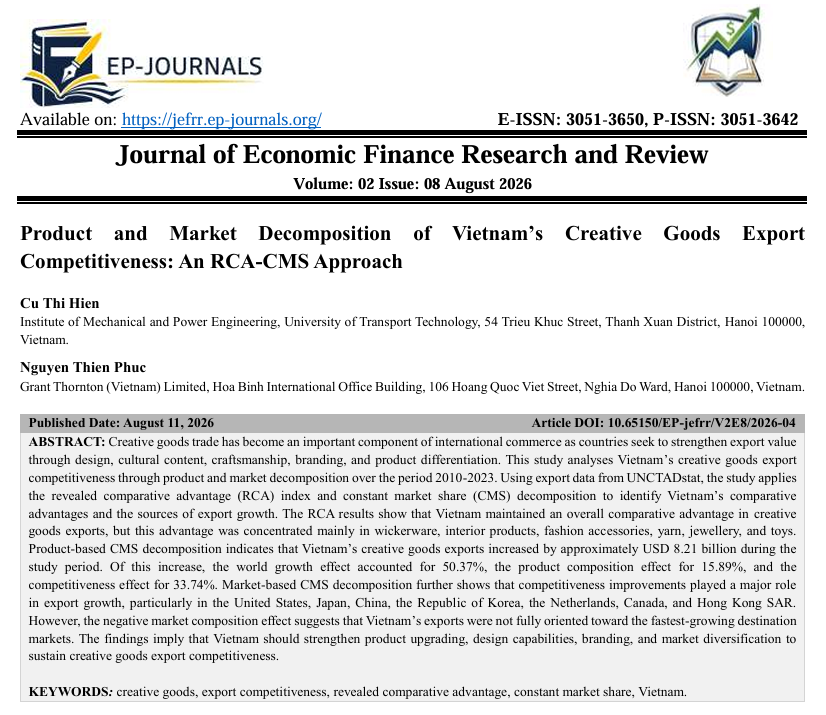
Product and Market Decomposition of Vietnam’s Creative Goods Export Competitiveness: An RCA-CMS Approach
DOI:
https://doi.org/10.65150/EP-jefrr/V2E8/2026-04Keywords:
creative goods, export competitiveness, revealed comparative advantage, constant market share, Vietnam.Abstract
Creative goods trade has become an important component of international commerce as countries seek to strengthen export value through design, cultural content, craftsmanship, branding, and product differentiation. This study analyses Vietnam’s creative goods export competitiveness through product and market decomposition over the period 2010-2023. Using export data from UNCTADstat, the study applies the revealed comparative advantage (RCA) index and constant market share (CMS) decomposition to identify Vietnam’s comparative advantages and the sources of export growth. The RCA results show that Vietnam maintained an overall comparative advantage in creative goods exports, but this advantage was concentrated mainly in wickerware, interior products, fashion accessories, yarn, jewellery, and toys. Product-based CMS decomposition indicates that Vietnam’s creative goods exports increased by approximately USD 8.21 billion during the study period. Of this increase, the world growth effect accounted for 50.37%, the product composition effect for 15.89%, and the competitiveness effect for 33.74%. Market-based CMS decomposition further shows that competitiveness improvements played a major role in export growth, particularly in the United States, Japan, China, the Republic of Korea, the Netherlands, Canada, and Hong Kong SAR. However, the negative market composition effect suggests that Vietnam’s exports were not fully oriented toward the fastest-growing destination markets. The findings imply that Vietnam should strengthen product upgrading, design capabilities, branding, and market diversification to sustain creative goods export competitiveness.
References
1) Ahmadi-Esfahani, F. Z. (2006). Constant Market Shares Analysis: Uses, Limitations and Prospects. Australian Journal of Agricultural and Resource Economics, 50(4), 510–526. https://doi.org/10.1111/j.1467-8489.2006.00364.x
2) Balassa, B. (1965). Trade Liberalisation and “Revealed” Comparative Advantage. The Manchester School, 33(2), 99–123.https://doi.org/10.1111/j.1467-9957.1965.tb00050.x
3) Bulut, O. D. (2025). COVID-19’s Impact on Türkiye’s Lemon Exports: Constant Market Share Decomposition (2015–2024).Sustainability, 17(19), 8700. https://doi.org/10.3390/su17198700
4) Cano-Espinosa, D., & Méndez-León, J. R. (2025). The Competitive Dynamics of Mexican Fresh Grapes in the U.S. Market. World, 6(1), 31. https://doi.org/10.3390/world6010031
5) Dong, C. Van, & Truong, H. Q. (2020). The Determinants of Creative Goods Exports: Evidence from Vietnam. Journal of Cultural Economics, 44(2), 281–308. https://doi.org/10.1007/s10824-019-09359-y
6) Mohamed, N. M. A., Kamal, K. M. M., Abdelkhalek, R. H. M., Binsuwadan, J., & Frega, K. A.-E. A. (2026). Creative Exports in a Fragmented Global Economy: The Role of Trade, Cultural, and Political Openness. Sustainability, 18(10), 4644.https://doi.org/10.3390/su18104644
7) Nguyen, N. M., & Nguyen, T. H. (2026). Constant Market Share Analysis of Vietnam’s Seafood Exports to the United States and China. Hue University Journal of Science: Economics and Development, 135(5S-1), 163–179. https://doi.org/10.26459/hueunijed.v135i5S-1.8321
8) Richardson, J. D. (1971). Constant-market-shares analysis of export growth. Journal of International Economics, 1(2), 227–239.https://doi.org/10.1016/0022-1996(71)90058-4
9) Şimşek, M. C. (2025). Creative Industries in Global Trade: An International Competitiveness Analysis. Journal of Life Economics, 12(1), e2691. https://doi.org/10.15637/jlecon.2691
10) Tran, Q. T. N., Nguyen, T. N. M., Le, L. K., Nguyen, G. H. T., Dinh, K. B., Le, T. M., & Trinh, T. M. (2025). The Impact of Macroeconomic Factors on the Creative Economy: A Comparative Analysis of European Countries and Asian Countries. Journal of International Economics and Management, 25(3), 202–215. https://doi.org/10.1108/JIEM-05-2025-0037
11) Tyszynski, H. (1951). World Trade in Manufactured Commodities, 1899–1950. The Manchester School, 19(3), 272–304.https://doi.org/10.1111/j.1467-9957.1951.tb00012.x
12) UNCTAD. (2024). Creative Economy Outlook 2024. United Nations Conference on Trade and Development.
13) UNCTAD. (2026, June 11). UNCTADstat Creative Economy Statistics Database. United Nations Conference on Trade and Development. https://unctadstat.unctad.org/
14) Zdráhal, I., Lategan, F. S., & van der Merwe, M. (2023). A Constant Market Share Analysis of the Competitiveness of the Czech Republic’s Agrifood Exports (2002–2020) to the European Union. Agricultural Economics, 69(12), 498–509. https://doi.org/10.17221/248/2023-AGRICECON
Downloads
Published
Issue
Section
License
Copyright (c) 2026 Cu Thi Hien, Nguyen Thien Phuc (Author)

This work is licensed under a Creative Commons Attribution 4.0 International License.